Predicting the outcome of a football match can feel like a guessing game. While luck and unpredictable moments are part of the sport's charm, a smarter approach involves using data. By analyzing a few key statistics, you can move beyond simple guessing and make more informed predictions.
Why Use Stats to Predict Matches
Predicting football matches accurately is tough — but using data gives you a measurable advantage over guesswork. Statistics remove emotion and bias from your decision making. This guide will introduce you to some of the most important metrics that professional analysts use. You'll learn the essential stats (xG, possession, shots on target, recent form), how to combine them into a simple model, and which tools to use.
Key Football Statistics — What They Mean and Why They Matter
| Stat | What it measures | Why it matters |
|---|---|---|
| xG (Expected Goals) | Quality of scoring chances (shot location, body part, assist type) | Better predictor of future goals than goals alone — shows chance quality |
| Possession % | Share of time the team controls the ball | Reflects control and ability to create chances (context needed) |
| Shots on Target | Shots that are on goal and would score if not saved | Direct measure of attacking threat and finishing opportunity |
| Recent Form (Last 5) | Points / results over the last 5 matches | Indicates momentum, morale, and short-term fitness |
1. Expected Goals (xG)
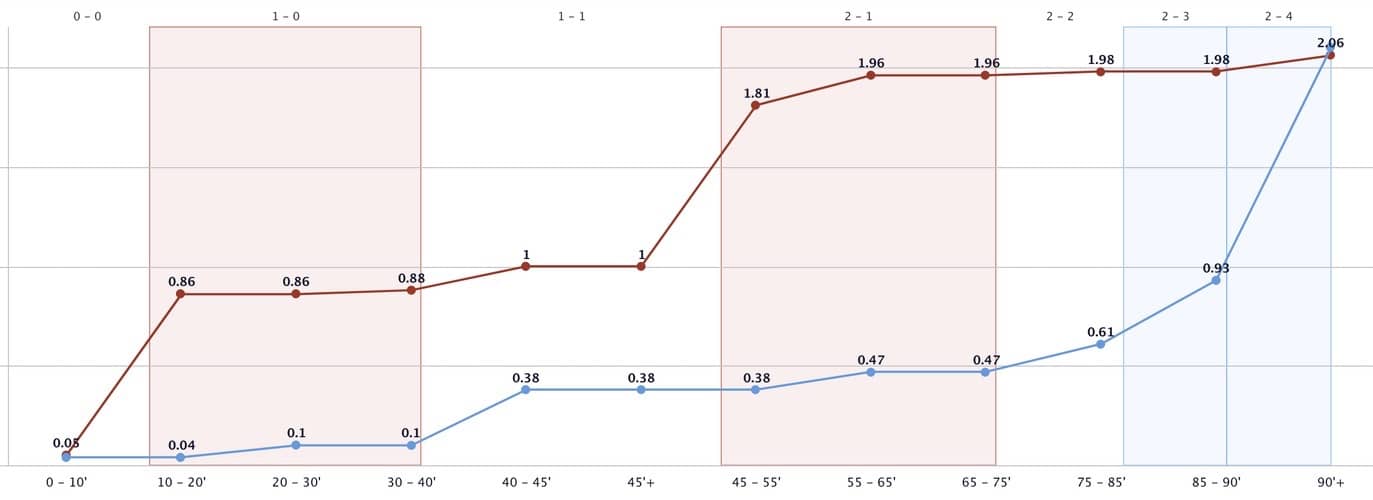
Expected Goals, or xG, is arguably the most revolutionary statistic in modern football analysis. It measures the quality of a scoring chance, giving each shot a value between 0 and 1. A shot from close range in front of an open goal might have a high xG value (e.g., 0.8), while a long-range shot from a tight angle will have a low xG value (e.g., 0.05).
Why is xG so important? Unlike simple goal tallies, xG tells you how many goals a team should have scored based on the chances they created. A team that wins 1-0 but has an xG of 0.5 might have been lucky, whereas a team that loses 2-1 with an xG of 3.0 was likely very unlucky.
How to use it Expected Goals (XG):
Look at a team's xG For (xGF) and xG Against (xGA) over several matches.
Compare the xG numbers to the actual scores. If a team is consistently outperforming its xG, it might be due for a negative correction. If it's underperforming, a win might be around the corner.
Example:
Team A averages 2.3 xG per game (creating many quality chances)
Team B averages 0.9 xG per game (creates very few chances)
→ Even if they’ve scored similar goals lately, Team A is statistically more likely to win.

Tip: Use Futbor, FBref, and Understat for reliable xG numbers.
2. Possession Percentage
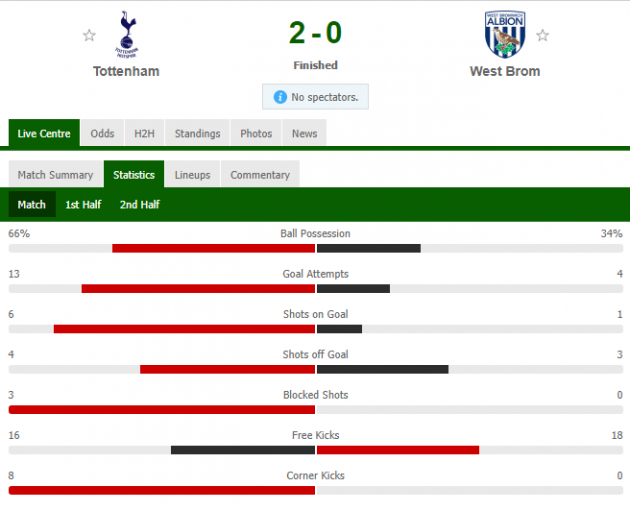
Possession measures how much of the game a team controls. A team with 65% possession is dominating the ball, dictating the pace of the match, and tiring out the opposition. However, possession alone is not enough to predict a winner.
The catch: Some teams, like Leicester City in their title-winning season, prefer to play on the counter-attack. They may have low possession but win because they are more efficient with the ball and exploit their opponents’ weaknesses.
How to use it possession percentage:
Look at possession in context. Is the team with high possession also creating more chances (high xG)? Is the counter-attacking team converting their chances (high shots on target)?
3. Shots on Target
While Expected Goals is a great qualitative metric, shots on target is a simple, effective quantitative one. It measures a team's attacking efficiency. A high number of shots on target indicates that a team is consistently getting the ball into dangerous positions and forcing the opposing goalkeeper to make saves.
How to use it shots on target:
Combine it with xG. A team with a high xG but a low number of shots on target might be creating a few very good chances, but is not consistent in its attack.
Compare it between teams. The team with more shots on target often has a better chance of winning.
4. Recent Form
This is perhaps the simplest but most crucial statistic to consider. A team's recent form tells you about its current momentum and morale. Are they on a winning streak, or have they lost their last three matches?
What to look for:
Win/Loss/Draw Record: Analyze the results of the last five to six games.
Goals Scored and Conceded: A team on a winning streak that has also scored a lot of goals and conceded very few is in great form.
Clean Sheets: A team that is not conceding goals is difficult to beat.

Build a Simple Prediction Model
Start small. Gather the last 5 matches for each team and calculate average values for the key metrics. Then assign simple weights and calculate a score.
Example dataset (last 5 matches averaged)
| Metric | Team A Avg | Team B Avg |
|---|---|---|
| xG | 2.1 | 1.3 |
| Shots on Target | 7 | 4 |
| Possession % | 62% | 43% |
Weighted score (example weightings)
Weights: xG = 40%, Shots-on-Target = 30%, Possession = 30%
| Team | Weighted score |
|---|---|
| Team A | (2.1×0.4)+(7×0.3)+(62×0.3) = 21.54 |
| Team B | (1.3×0.4)+(4×0.3)+(43×0.3) = 14.62 |
Result: Team A is the statistical favorite.
Test Your Predictions and Improve
- Record your predictions for each match and the outcome.
- Track how often your model is right — aim for long-term accuracy.
- Adjust your weightings. If you notice xG is a stronger predictor than possession, increase its weight.
- Important: No model is perfect — even the best models get about 55–65% of results correct. That’s normal.
Other Useful Stats
Fouls and Cards: High foul rates might indicate defensive aggression, leading to penalties or red cards.
Home/Away Performance: Many teams perform better at home due to crowd support.
Things Stats Don’t Always Catch
Statistics are powerful, but they miss context. Before finalizing a prediction check:
- Injuries & Suspensions: Losing a key striker or goalkeeper changes xG expectations.
- Home vs Away Performance: Some teams dominate at home but struggle away.
- Motivation: Teams in relegation battles or finals often play above their usual level.
- Weather & Pitch: Heavy rain or a poor pitch reduces passing teams’ advantage.
- Fixture congestion: Teams playing too many matches in a short time get fatigued.
.
Tools & Data Sources
You don’t have to track everything manually. Use these free websites and tools to collect reliable data:
- FBref — excellent for team and player stats including xG
- Understat — strong xG dataset and per-player xG
- Sofascore — live stats, ratings and match events
- WhoScored — tactical metrics, player ratings
- futbor - data-driven stats and analysis
📌 Tip: Build a simple spreadsheet where you track teams, their xG, shots on target, and recent form side-by-side.
Test, Track & Improve
Track every prediction and result. Over time you can tune weights, add metrics (xG differential, expected points) and improve accuracy. A good benchmark for a simple model is to beat random guessing and aim for consistent >55% accuracy across many matches.
Final Tips
Learning how to predict football matches using stats starts with understanding xG, possession, shots on target, and recent form. Start small—analyze one match per week—and build from there. Remember, no prediction is foolproof, but stats give you the best shot at accuracy. Happy predicting! And don't forget to share your predictions in our football forum.
- Use stats as a guide, not a guarantee.
- Always include context checks before making a prediction.
- Be disciplined about bankroll if you bet; never stake more than you can afford to lose.

